米国株式投資のシステムトレードプラットフォームである 「Quantopian」 を使用してPythonで売買アルゴリズムを開発します。
トレーディングアルゴリズムを1つの「Factor(指標)」のみで構築する事は稀です。
このページでは、「Pipeline」の「Factor」の応用例として、合成ファクターを作成する方法について解説します。

Pipelineで出来ること
Pipelineの基礎については、以下のページを参考にして下さい。
「Pipeline」を定義して実行
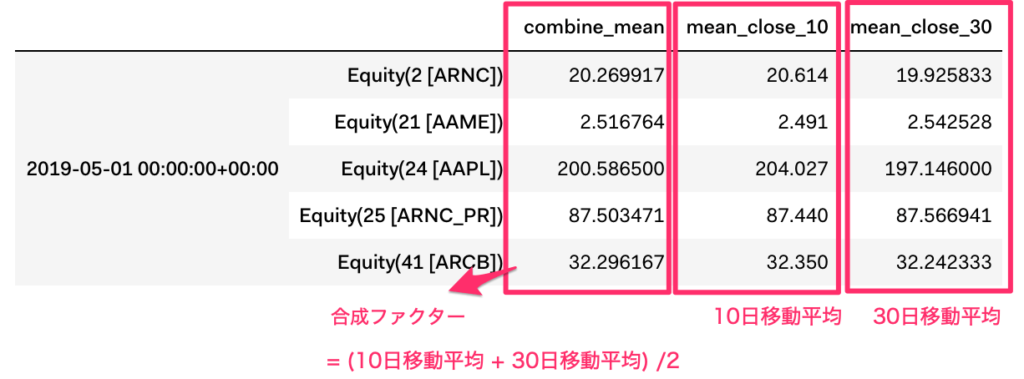
株価の終値の「10日移動平均」、「30日移動平均」、「(10日移動平均+30日移動平均)/ 2」を返すPipelineを定義し、実行します。
#ライブラリのインポート
from quantopian.pipeline import Pipeline
from quantopian.research import run_pipeline
from quantopian.pipeline.data.builtin import USEquityPricing
from quantopian.pipeline.factors import SimpleMovingAverage

#パイプライン定義
def make_pipeline():
    mean_close_10 = SimpleMovingAverage(inputs=[USEquityPricing.close], window_length=10)#10日移動平均
    mean_close_30 = SimpleMovingAverage(inputs=[USEquityPricing.close], window_length=30)#30日移動平均

    #合成ファクター =(10日移動平均+30日移動平均) / 2
    combine_mean = (mean_close_10 + mean_close_30) / 2

    return Pipeline(
        columns={
            'mean_close_10': mean_close_10,
            'mean_close_30': mean_close_30,
            'combine_mean': combine_mean
        }
    )

#パイプラインの実行
result = run_pipeline(make_pipeline(), '2019-05-01', '2019-05-01')

#結果を表示
result.head()
実行結果
「10日移動平均」、「30日移動平均」、「(10日移動平均+30日移動平均)/ 2」をインデックスとした「DataFrame」が表示されます。
解説
簡単に、コードの解説をします。
必要なモジュールのインポート
まず、「Pipeline」作成に必要なモジュールをインポートします。
#ライブラリのインポート
from quantopian.pipeline import Pipeline
from quantopian.research import run_pipeline
from quantopian.pipeline.data.builtin import USEquityPricing
from quantopian.pipeline.factors import SimpleMovingAverage
Pipelineの定義
「pipeline」の定義をしています。
def make_pipeline():
    mean_close_10 = SimpleMovingAverage(inputs=[USEquityPricing.close], window_length=10)#10日移動平均

    mean_close_30 = SimpleMovingAverage(inputs=[USEquityPricing.close], window_length=30)#30日移動平均

    #合成ファクター =(10日移動平均+30日移動平均) / 2
    combine_mean = (mean_close_10 + mean_close_30) / 2

    return Pipeline(
        columns={
            'mean_close_10': mean_close_10,
            'mean_close_30': mean_close_30,
            'combine_mean': combine_mean
        }
    )
10日移動平均の計算
「SimpleMovingAverage」関数を使用して、10日移動平均を計算しています。
mean_close_10 = SimpleMovingAverage(inputs=[USEquityPricing.close], window_length=10)#10日移動平均
合成ファクターの計算
「(10日移動平均+30日移動平均)/ 2」の合成ファクターを定義しています。
    #合成ファクター =(10日移動平均+30日移動平均) / 2
    combine_mean = (mean_close_10 + mean_close_30) / 2
Pipelineの実行
最後に、Pipelineを実行します。実行には、「run_pipeline」をインポートする必要があります。
「make_pipeline」を「2019-5-1」から「2019-5-1」の期間で実行します。
#Pipelineの実行
from quantopian.research import run_pipeline

#パイプラインの実行
result = run_pipeline(make_pipeline(), '2019-05-01', '2019-05-01')
結果を表示
Pipelineを実行した結果の先頭5行を表示します。
#結果を表示
result.head()
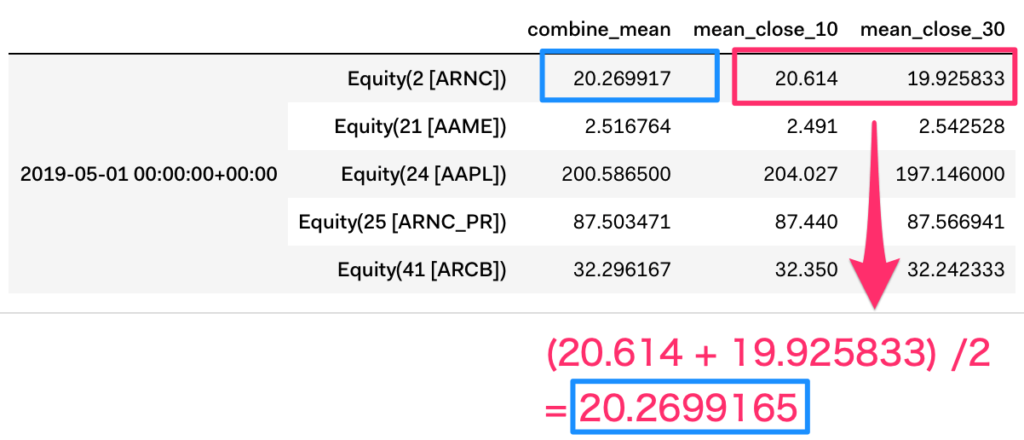
検証
Pipelineを実行した結果から、「合成ファクター」が定義通りに正しく計算されている事がわかります。
参考ページ(公式チュートリアル)
「Quantopian」学習のオススメ講座

「Python for Financial Analysis and Algorithmic Trading 」は、Pythonで金融分析やアルゴリズムトレーディングを作成するための講座です。
世界的に有名なUdemy講師であるJose氏が、「Quontopian」について動画で解説している稀有な講座です。
例えば、「ボリンジャーバンド」を活用したトレーディングアルゴリズムを作成する事が出来ます。