米国株式投資のシステムトレードプラットフォームである 「Quantopian」 を使用してPythonで売買アルゴリズムを開発します。
このページでは、「Pipeline」で株式銘柄をフィルタリングする方法を学びます。(例えば、株価の上昇率100銘柄のみ取得するなど)
Pipelineでフィルタリングするとは?
「Quantopian」では、「Pipeline」オブジェクトを利用する事で、データ(終値等)を時系列に取得し、銘柄をフィルタリング出来ます。
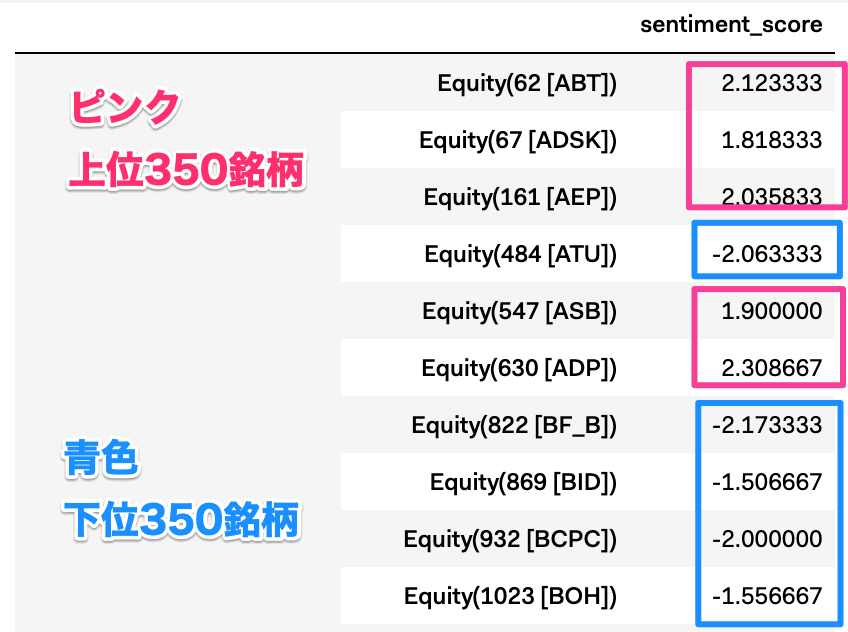
例:2019年4月1日のTwitter「センチメント」の上位350銘柄と下位350銘柄を抽出

フィルタリング結果を投資戦略に活かすには?
センチメントが高いという事は、市場が企業の先行きを「楽観的」に捉えている事を表しています。
ですので、この見通しに素直に従う場合(順張り)では、当該銘柄を「買い」ます。
そして、逆に低いものは先行きを「悲観的」に捉えているので「売る」といった戦略が作れます。
要は、皆が良さそうと思っている株を「買い」、悪そうと思っている銘柄を「売る」という事ですね。
「Pipeline」を定義して実行
# インポート
from quantopian.pipeline import Pipeline
from quantopian.pipeline.data.psychsignal import stocktwits
from quantopian.pipeline.factors import SimpleMovingAverage
from quantopian.pipeline.experimental import QTradableStocksUS

# Pipeline定義
def  make_pipeline():

    base_universe = QTradableStocksUS()

    sentiment_score = SimpleMovingAverage(
        inputs=[stocktwits.bull_minus_bear],
        window_length=3,
    )

    # Create filter for top 350 and bottom 350
    # assets based on their sentiment scores
    top_bottom_scores = (
        sentiment_score.top(350) | sentiment_score.bottom(350)
    )

    return Pipeline(
        columns={
            'sentiment_score': sentiment_score,
        },
        # Set screen as the intersection between our filter
        # and trading universe
        screen=(
            base_universe
            & top_bottom_scores
        )
    )

#Pipelineの実行
from quantopian.research import run_pipeline

result = run_pipeline(
    make_pipeline(),
    start_date='2019-04-01',
    end_date='2019-04-01'
)

#Pipelineの実行結果を表示
result.head(10)
実行結果
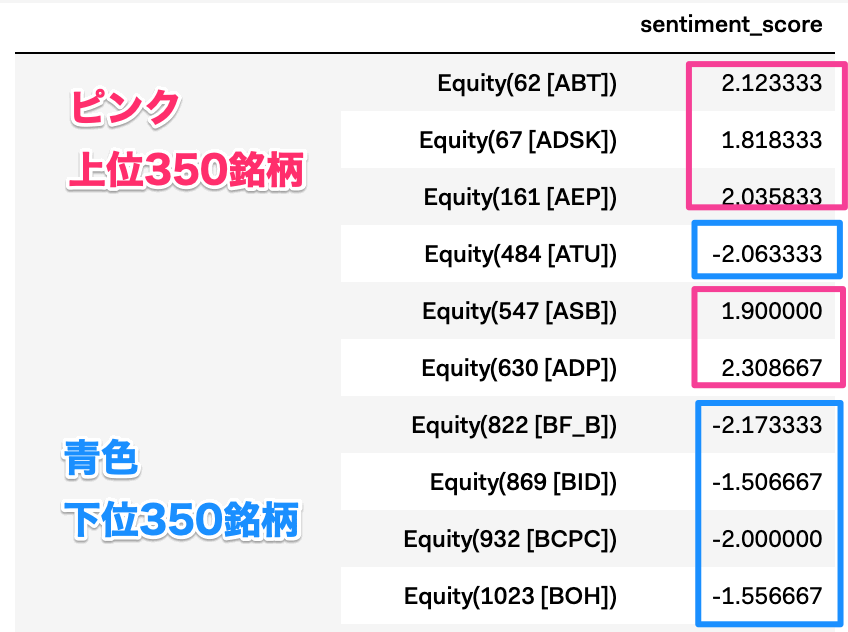
結果は、「日付」と「株式銘柄」をインデックスとしたpandasの「DataFrame」となります。
プラスがsentiment_scoreの上位350銘柄、マイナスが下位350銘柄です。

解説
簡単に、コードの解説をします。
必要なモジュールのインポート
まず、「Pipeline」作成に必要なモジュールをインポートします。
# インポート
from quantopian.pipeline import Pipeline
from quantopian.pipeline.data.psychsignal import stocktwits
from quantopian.pipeline.factors import SimpleMovingAverage
from quantopian.pipeline.experimental import QTradableStocksUS
Pipelineの定義
次に、「pipeline」を定義します。「make_pipeline」という名前で定義していますが、名前は好きなもので定義する事が出来ます。
# Pipeline定義
def  make_pipeline():

    base_universe = QTradableStocksUS()

    sentiment_score = SimpleMovingAverage(
        inputs=[stocktwits.bull_minus_bear],
        window_length=3,
    )

    # Create filter for top 350 and bottom 350
    # assets based on their sentiment scores
    top_bottom_scores = (
        sentiment_score.top(350) | sentiment_score.bottom(350)
    )

    return Pipeline(
        columns={
            'sentiment_score': sentiment_score,
        },
        # Set screen as the intersection between our filter
        # and trading universe
        screen=(
            base_universe
            & top_bottom_scores
        )
    )
スクリーニング
        screen=(
            base_universe
            & top_bottom_scores
        )
最後のスクリーンの箇所でフィルタリングをしているのがポイントです。
&で「base_universe」と「top_bottom_scores」の両者を満たすものを対象として結果を取得します。
base_universe
「base_universe = QTradableStocksUS()」と、Quantopianが選択した流動性が高く取引がしやすい銘柄を対象としています。
top_bottom_scores
「top_bottom_scores」でTwitterのセンチメント(楽観-悲観)の上位350銘柄と下位350銘柄を取得しています。
    top_bottom_scores = (
        sentiment_score.top(350) | sentiment_score.bottom(350)
    )
Pipelineの実行
次に、Pipelineを実行します。実行には、「run_pipeline」をインポートする必要があります。
「make_pipeline」を「2019-4-1」から「2019-4-1」の期間で実行します。
#Pipelineの実行
from quantopian.research import run_pipeline

result = run_pipeline(
    make_pipeline(),
    start_date='2019-04-01',
    end_date='2019-04-01'
)
結果を表示
Pipelineの結果を表示します。「日付」と「Twitterのセンチメントスコア(3日移動平均)」をインデックスとしたpandasの「DataFrame」となります。
#Pipelineの実行結果を表示
result
参考ページ(公式チュートリアル)
「Quantopian」学習のオススメ講座

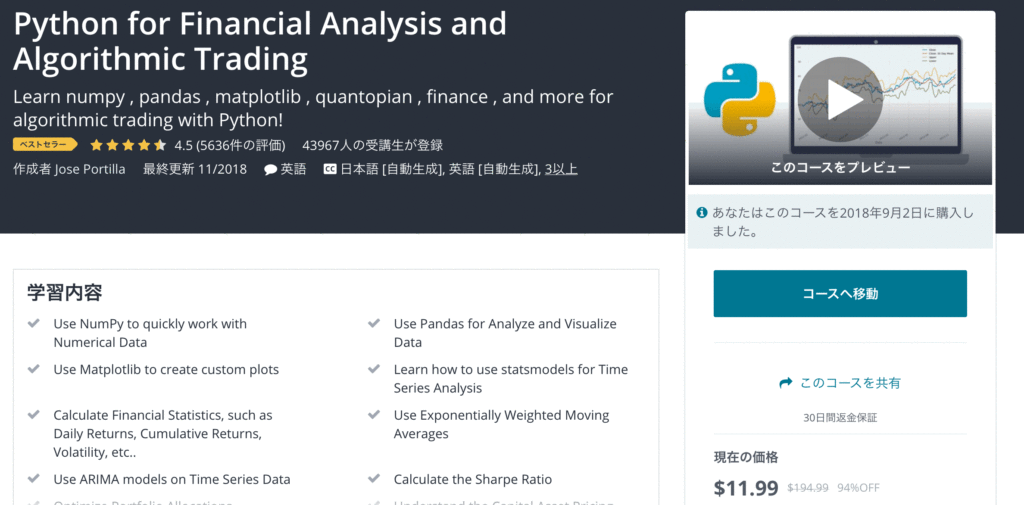
「Python for Financial Analysis and Algorithmic Trading 」は、Pythonで金融分析やアルゴリズムトレーディングを作成するための講座です。
世界的に有名なUdemy講師であるJose氏が、「Quontopian」について動画で解説している稀有な講座です。
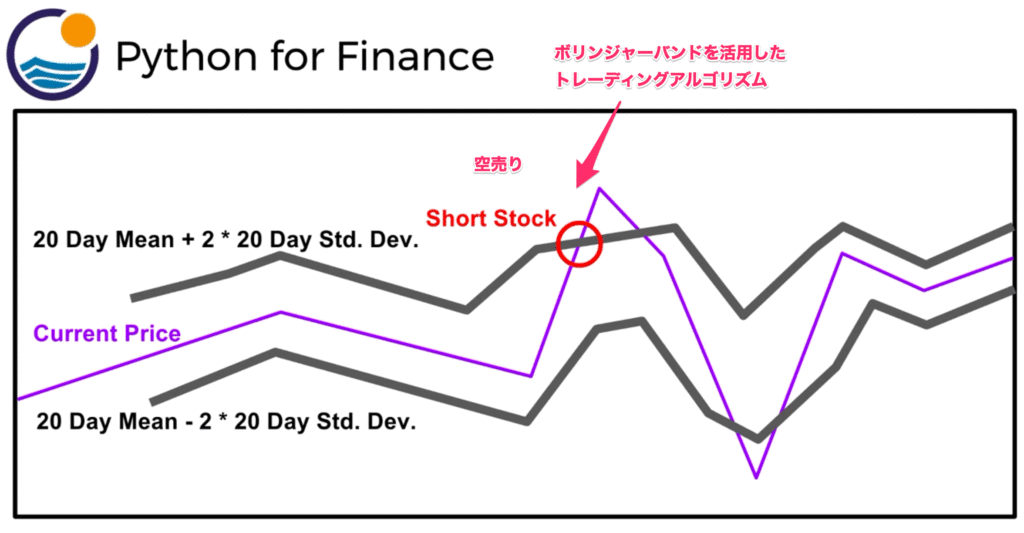
例えば、「ボリンジャーバンド」を活用したトレーディングアルゴリズムを作成する事が出来ます。
