米国株式投資のシステムトレードプラットフォームである 「Quantopian」 を使用してPythonで売買アルゴリズムを開発します。
このページでは、「Quantopian」で株価データの扱いを学びましょう。

Quantopianとは?
「Quantopian」 は、Pythonベースの米国株式投資のシステムトレードプラットフォームです。
金融データは基本的に無料で提供され、オンライン上に「Python」でトレーディングアルゴリズム(投資アルゴリズム)を書いていきます。
Apple株の株価を表示するコード
それでは、Appleの株価を取得して、表示しましょう。
# Research environment functions
from quantopian.research import prices, symbols

# Pandas library: https://pandas.pydata.org/
import pandas as pd

# Query historical pricing data for AAPL
aapl_close = prices(
    assets=symbols('AAPL'),
    start='2013-01-01',
    end='2016-01-01',
)

# Compute 20 and 50 day moving averages on
# AAPL's pricing data
aapl_sma20 = aapl_close.rolling(20).mean()
aapl_sma50 = aapl_close.rolling(50).mean()

# Combine results into a pandas DataFrame and plot
pd.DataFrame({
    'AAPL': aapl_close,
    'SMA20': aapl_sma20,
    'SMA50': aapl_sma50
}).plot(
    title='AAPL Close Price / SMA Crossover'
);
実行結果
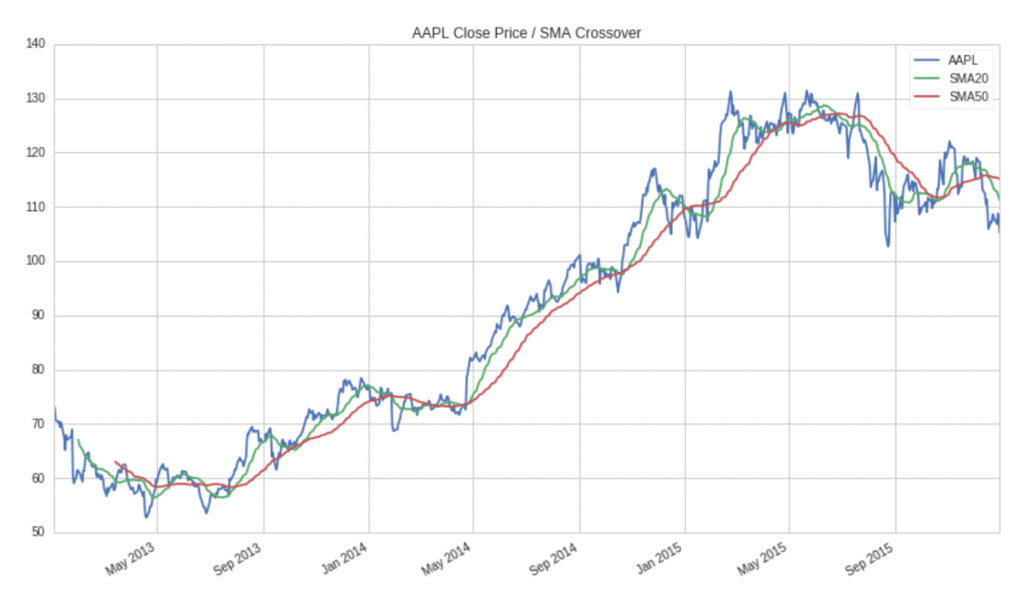
Apple株価をグラフとした結果は、以下の通りです。

SMA20とは、「20日移動平均線」、SMA50とは、「50日移動平均線」です。
直近20日間、50日間の平均線で、株価の大まかなトレンドを分析する為に良く使われます。
解説
簡単に、コードの解説をします。
必要なパッケージのインポート
まず、「Quantopian」の「research」から「prices」と「symbols」をインポートしてます。
「pandas」はおなじみなので、解説不要ですね?
# Research environment functions
from quantopian.research import prices, symbols

# Pandas library: https://pandas.pydata.org/
import pandas as pd
Appleの株価を取得する設定
pricesを使用して、Appleの株価を「2013年1月」から「2016年1月」まで取得する設定です。
“AAPL”がAppleを表しており、ここを変更する事で色々な会社の株価を取得できます。
# Query historical pricing data for AAPL
aapl_close = prices(
    assets=symbols('AAPL'),
    start='2013-01-01',
    end='2016-01-01',
)
Appleの株価の移動平均を計算
先ほど取得したaapl_closeに対して、「rolling(日数).mean()」で移動平均を計算しています。
# Compute 20 and 50 day moving averages on
# AAPL's pricing data
aapl_sma20 = aapl_close.rolling(20).mean()
aapl_sma50 = aapl_close.rolling(50).mean()
結果をグラフとして表示
株価情報、移動平均の結果を結合し、pandasのDataFrame型にしています。
あとは、plotでグラフとして描画するだけです。
# Combine results into a pandas DataFrame and plot
pd.DataFrame({
    'AAPL': aapl_close,
    'SMA20': aapl_sma20,
    'SMA50': aapl_sma50
}).plot(
    title='AAPL Close Price / SMA Crossover'
);
GAFAの株価推移をグラフとして描画
それでは、もう少しステップアップして、GAFA(「Google」, 「Apple」, 「Facebok」, 「Amazon」)の株価推移を表示してみましょう。
# Research environment functions
from quantopian.research import prices, symbols

# Pandas library: https://pandas.pydata.org/
import pandas as pd

# GAFAの株価情報を取得する(Query historical pricing data)

start_date ='2017-01-03'
end_date   ='2019-02-01'

# GOOG(Google社)
googl_close = prices(
    assets=symbols('GOOG'),
    start=start_date,
    end=end_date,
)

# AAPL(Apple社)
aapl_close = prices(
    assets=symbols('AAPL'),
    start=start_date,
    end=end_date,
)

# FB(Facebook社)
fb_close = prices(
    assets=symbols('FB'),
    start=start_date,
    end=end_date,
)

# AMZN(Amazon社)
amzn_close = prices(
    assets=symbols('AMZN'),
    start=start_date,
    end=end_date,
)

# Combine results into a pandas DataFrame and plot
pd.DataFrame({
    'Google': googl_close/googl_close.loc[start_date]*100,
    'Apple': aapl_close/aapl_close.loc[start_date]*100,
    'Facebook': fb_close/fb_close.loc[start_date]*100,
    'Amazon': amzn_close/amzn_close.loc[start_date]*100,
}).plot(
    title='GAFA Close Price(Jan 2017 = 100)'
);
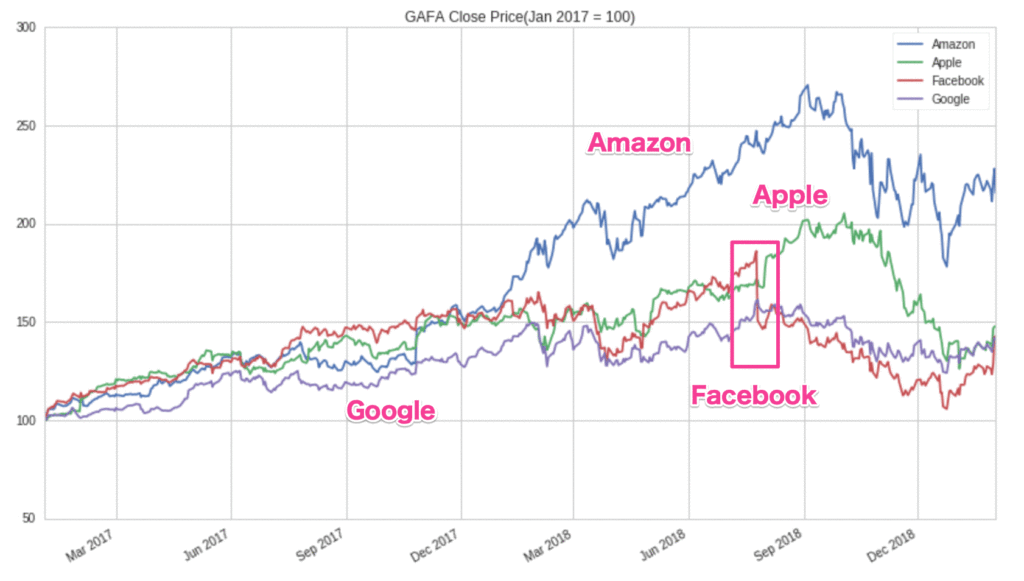
「start_date」と「end_date」を変数として共通化し、また株価水準が異なるので、2017年の「start_date」の株価を100としてグラフとしている所がポイントです。
実行結果

2017年からの相対的な株価推移を見ていくと、やはりAmazonが強いですね。
Facebookは公聴会問題などもあって、ガッツリと株価が下がっている期間もあrます。
公式チュートリアル
「Quantopian」学習のオススメ講座

「Python for Financial Analysis and Algorithmic Trading 」は、Pythonで金融分析やアルゴリズムトレーディングを作成するための講座です。
世界的に有名なUdemy講師であるJose氏が、「Quontopian」について動画で解説している稀有な講座です。
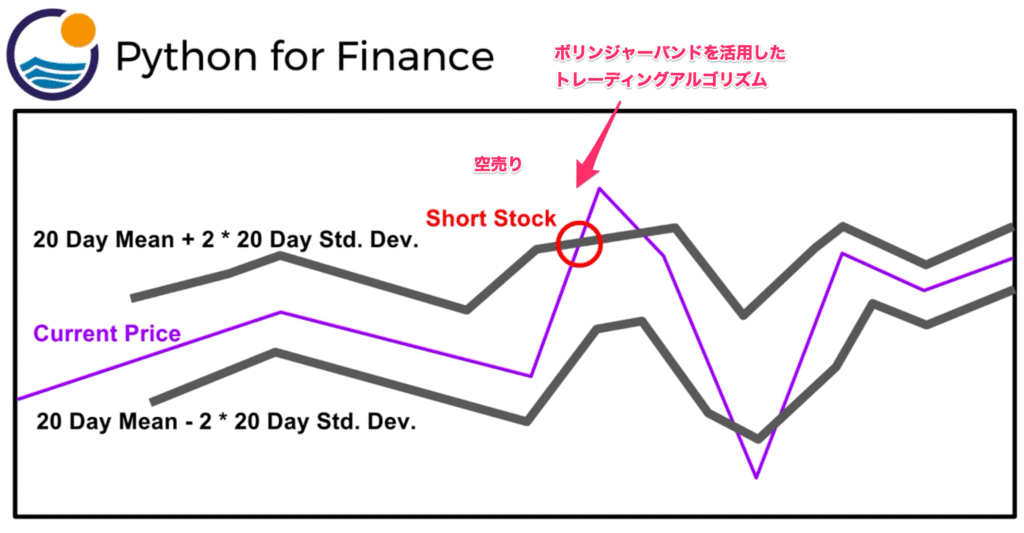
例えば、「ボリンジャーバンド」を活用したトレーディングアルゴリズムを作成する事が出来ます。
